Mastering Cloud Monitoring
A Professional's Guide to Azure Monitor Alert


Azure Monitor is like a guardian for your Microsoft Azure cloud services. It keeps an eye on what's happening in your cloud and even in your own computer systems.
Let's say you have a security camera in your home. If someone tries to break in, the camera detects the movement and alerts you. Similarly, Azure Monitor sends you automatic alerts when something important happens in your Azure cloud, like if too many people are using your website at once or if there's an unexpected problem. These alerts are like messages that tell you what's going on with your Azure services and resources. You can set them to notify you with a message when certain conditions like your website receiving a lot of traffic or too many errors taking place are met.
And the best thing is, you can customize these alerts to fit your needs, just like you adjust your camera settings to click the perfect picture. With Azure Monitor alerts, you can make sure you are well aware about what's happening in your Azure cloud in ways that work best for you.
How does Azure Monitor Alert Work?
The following diagram shows how Azure Monitor alerts works in the back end:
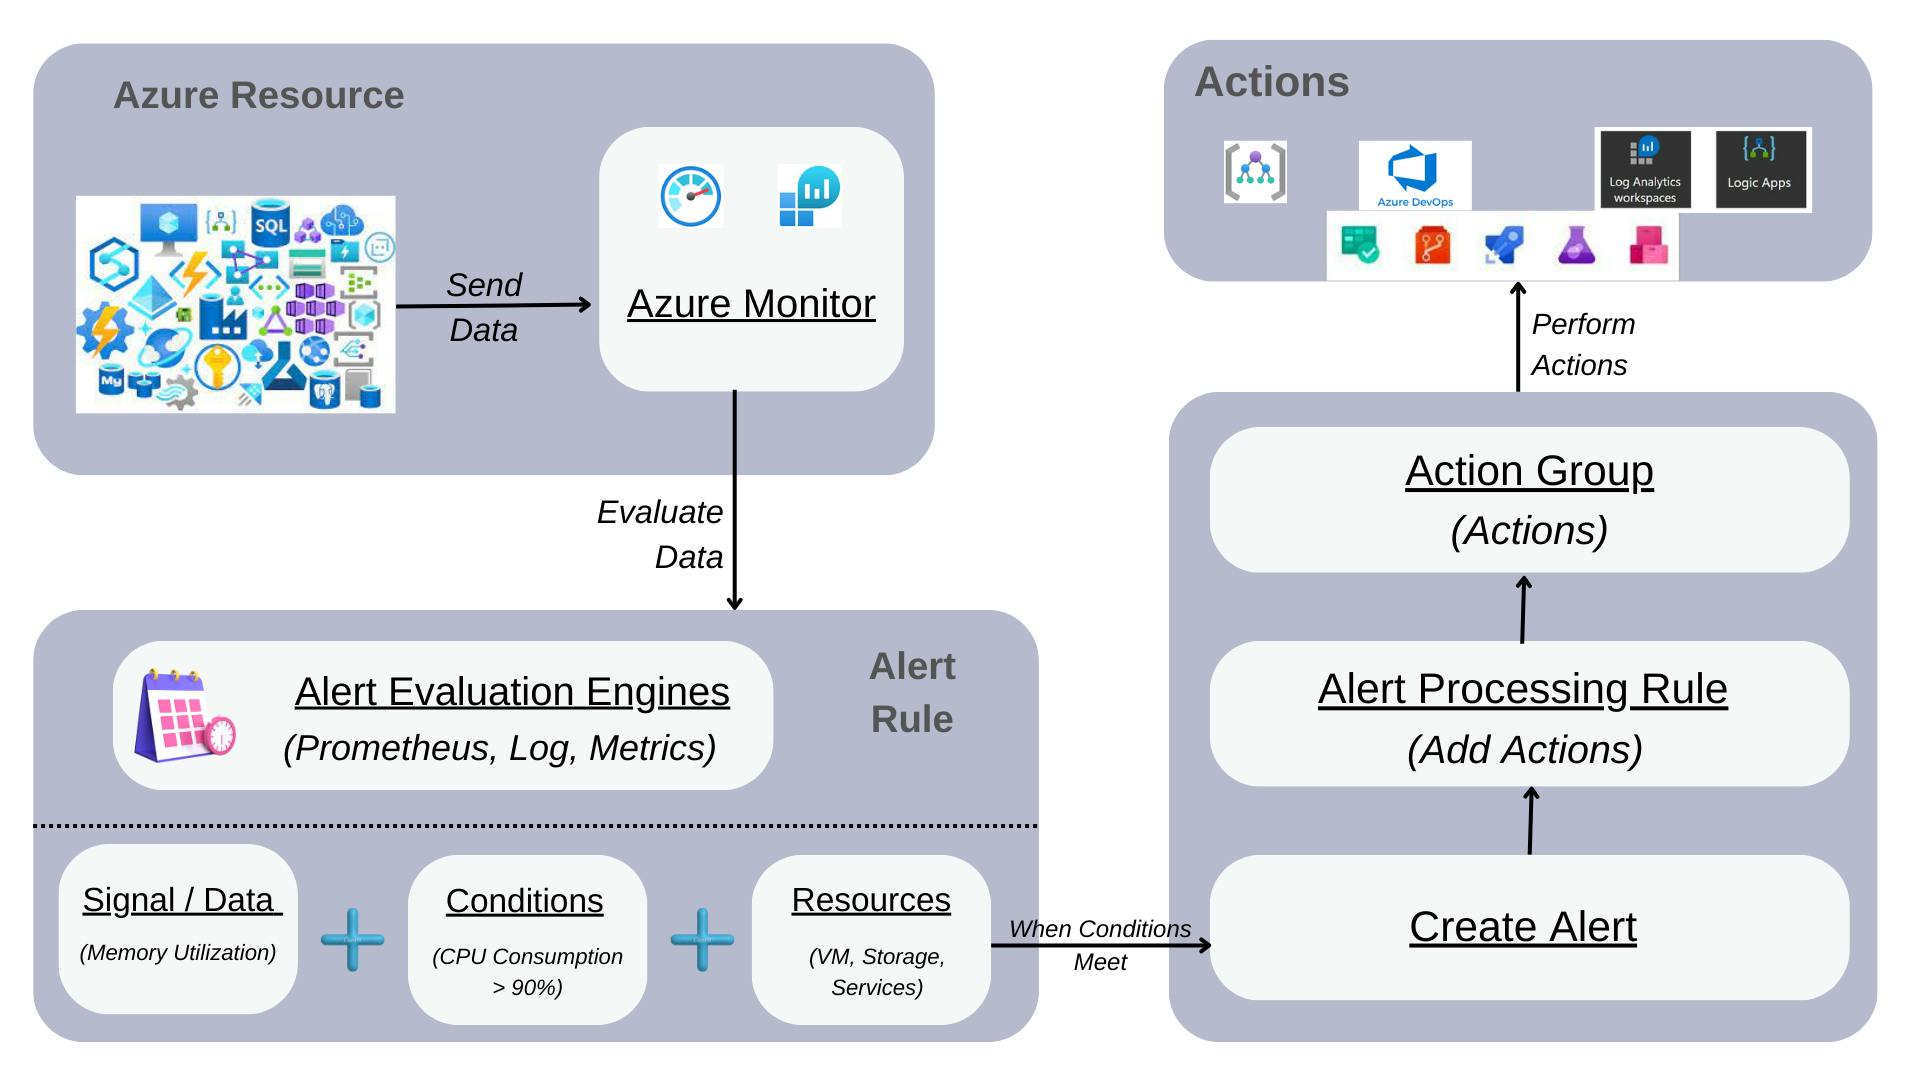
A Microsoft Azure Alert is like a watchman for your data. It keeps an eye on a specific thing you care about (like a website or a database) and looks out for any signs that something unusual is happening.
The alert rule is like the instructions for the watchman. It tells the watchman what to pay attention to, like what data to look at and what conditions to watch for. If the watchman sees something that matches these conditions, it raises an alert.
The alert rule is made up of three things:
Resources to be Monitored: The things the watchman needs to keep an eye on.
Signal or Data from the Resource: The information the watchman is checking for.
Conditions: The rules that the watchman follows to decide if there's a problem.
When the watchman sees something that matches the rules, it sets off an alert. This alert can then trigger actions you've set up (like sending a notification or running a script).
If you're watching multiple things (resources and services), the watchman checks each one separately. So, if there are issues with more than one thing, you'll get alerts for each one.
These alerts are kept for 30 days. After that, they're automatically deleted. You can see all the alerts for your Azure resources on the Alerts page in the Azure portal.
What does Alert consist of?
In Microsoft Azure Alert, there are a few important parts:
Action Groups: Think of these like a team of messengers. When something important happens (like an alert), this team can notify you in different ways, like sending emails, text messages, or push notifications. They can also perform automated tasks, like running specific programs or sending information to other apps.
Alert Conditions: These are like the rules the system follows to decide if there's a problem. When an issue comes up, the condition is set to "fired," indicating there's a situation to pay attention to. The condition changes to "resolved,", once the problem is fixed, to say that everything is in its place.
User Response: This is your role in the process. You decide what actions should be taken and this decision stays in place until you decide to change it. It's like having control over what happens when an alert comes up.
Alert Processing Rules: These are like additional instructions you can give to the system when alerts are happening. You can modify how alerts are handled – adding or removing messengers (action groups), putting filters in place, or having certain rules apply at specific times. It's like customizing how your team of messengers should behave during different situations – making sure they do exactly what you need them to do.
Types of Azure alerts
In Microsoft Azure, there are different types of alerts, and each serves a specific purpose. Here's a breakdown:
Metric Alerts:
Think of these like health check-ups for your resources. They regularly look at things like CPU usage or the number of requests your system is handling. If something goes beyond normal (like too many requests), the alert is triggered, and you get notified. It's an easy way to keep tabs on how your resources are performing.
Log Search Alerts:
These alerts focus on the detailed information your resources generate, like logs of operations and events. You can create specific rules using queries to filter and analyze these logs. If a log matches the conditions you set (for example, an error in your application), you get an alert. It helps you monitor the health and performance of your applications.
Activity Log Alerts:
Imagine having a journal for your resources. Activity logs keep track of actions performed on your resources, like creating, modifying, or deleting. Activity log alerts notify you when specific operations happen. This is useful for tracking changes, ensuring authorized actions, and staying compliant with company policies.
Smart Detection Alerts:
These are like your app's personal detectives. They automatically warn you about potential problems or anomalies in your web application's performance. If something seems off, you're alerted. It's a smart way to stay ahead of issues in your web applications.
Prometheus Alerts:
This type of alert is like having a specialized tool for monitoring and alerting, called Prometheus. It uses a powerful language called PromQL to set up rules based on metrics collected from your resources. When conditions specified in the rule are met, you receive an alert, ensuring you're aware of important events in your system.
States of Azure alert
In Microsoft Azure Alerts, there are two states: stateless and stateful.
Stateless Alerts:
These alerts fire every time the condition is met, no matter if it happened before. They are like always-on alarms. For example, imagine you set an alert for tracking activity logs. Every time a specific action occurs, the alert will fire and notify you, regardless of previous alerts.
Important Points:
All activity log alerts are stateless, meaning they keep notifying you about each event.
Frequency matters for stateless metric alerts. If the alert checks conditions frequently (less than 5 minutes), notifications come between 1 to 6 minutes. If it's less frequent (more than 5 minutes), notifications come between the configured frequency and double that frequency.
Stateful Alerts:
These alerts only fire when the conditions are met, and they won't bother you again until the issue is resolved. It's like a helpful alert that knows not to nag you repeatedly. Let's say you have a metric alert for CPU usage. It will only alert you when the CPU is over the limit, and it won't keep bothering you until the CPU usage is back to normal.
Resolution of Alerts:
For stateful alerts, the alert condition stays active until the issue is considered resolved.
Even though the alert itself is deleted after 30 days, the alert condition is stored until the issue is fixed to avoid unnecessary alerts. This way, you receive a notification when the problem is resolved.
How to alert at scale
In Microsoft Azure, setting up alerts is crucial, especially when dealing with a large number of resources. Let's break down some methods and considerations for alerting at scale.
1. Metric Alerts:
Think of these like alarms for specific types of resources, like websites or databases, all in the same area. For services that support it, one rule can monitor many resources. If not, you can use tools like Azure CLI or PowerShell to set up the same rule for multiple resources. Each rule is charged based on the number of things it's keeping an eye on.
Example: Imagine you have 20 virtual machines in the same region. Instead of creating 20 individual rules, you can set up one rule to watch all of them.
2. Log Search Alerts:
These alerts focus on detailed data sent to the Log Analytics workspace. You can monitor resources from different areas and subscriptions. By using Split by dimensions, you get an alert for each resource meeting the condition. The cost is based on the number of data streams created by your query.
Example: You have applications sending logs from various subscriptions. With Log Search Alerts, you can set up rules to monitor all of them separately.
3. Azure Policies:
Azure policies help in alerting at scale by easily setting up alerts. It's convenient but might add overhead in managing a large set of rules.
Example: You want to ensure all your virtual machines follow specific security standards. You can use Azure policies to set up alerts whenever a machine deviates from these standards.
4. Role-Based Access Control (RBAC):
RBAC ensures that only those with proper permissions can access, create, or manage alerts for specific resources. Depending on your role (like Monitoring Contributor or Monitoring Reader), you can create and view alerts within your scope.
Example: If you're responsible for a specific set of resources, RBAC ensures you can set up and manage alerts for those resources without interfering with others.
Important Note: When creating an alert rule, you need the right permissions for the target resource, the resource group it's in, and any associated action groups.
Understanding these methods helps you choose the right way to set up alerts for your Azure resources.
Pricing of Azure Alerts
Now, let's finally look into the pricing of Azure Monitor Alerts. Azure Monitor Alerts don't come with a one-size-fits-all price. Instead, they offer flexibility in pricing to fit your needs.
Here's the breakdown:
Pay-as-you-go:
Think of this like paying for what you use. You're charged based on the number of alerts you create and evaluate.
For example, if you set up alerts for your website and database, you'll only pay for the alerts related to these services.
Capacity Reservation:
This is like reserving space for your alerts. You pay a fixed monthly cost to have a certain capacity available. It's helpful if you know you'll have a consistent number of alerts and want a stable cost.
Important Point:
The pricing is different for metric alerts (like monitoring CPU usage), log alerts (checking detailed logs), and activity log alerts (keeping track of actions on resources). Each type of alert has its own pricing, so you can choose what suits your needs best.
Real-life Example:
Imagine you run an online store. You set up alerts to notify you if there's a sudden surge in website traffic (metric alert), if there are errors in the system logs (log alert), and if someone makes unauthorized changes to your product database (activity log alert).
With pay-as-you-go, you pay based on how many of these alerts you set up. With capacity reservation, you might choose to reserve a set amount of alert capacity each month, ensuring you have space for all your alerts without worrying about fluctuating costs.
If you want more details, you can check out the pricing information here.
Stay tuned for more advice on different areas of Azure and its services, and please feel free to share your own tips for managing your alerts on Azure in the comments!
This article is part ofAzure Spring Clean